The Denstiy Of States (DOS) and the Inverse Partitipation Ratio (IPR) are two interesting properties for understanding the electronic structure of a system.
The DOS is just a histogram counting the amount of states (molecular orbitals/wavefunctions) per energy unit, and analyzing these distributions, we can understand better the electronic behavior of our system.
The IPR is a way to analyze the “amount of localization” of these states, so that the larger the value of IPR the higher the localization around an specific covalent bond.
We used these two properties in an article published in Phys. Rev. B, named “Polymorphism in phase-change materials: melt-quenched and as-deposited amorphous structures in Ge2Sb2Te5 from“, which you can check for more information.
Here is the way to get that picture with CPMD:
- For the DOS: calculate the wavefunction by using the “
OPTIMIZE WAVEFUNCTION” or “OPTIMIZE GEOMETRY” keywords. To make sure that the eigenvalues and occupation are printed to the ouput, we add for example, the “LANCZOS DIAGONALIZATION” keyword in the CPMD section. - For the IPR: use the wavefunctions from the previous calculation for calculating the properties by adding “
RESTART ALL“. Set calculation type to “PROPERTIES” and add the following section:
  &PROPERTIES

PROJECT WAVEFUNCTION

&END - Extract the data from the CPMD output:
- File containing the Kohn-Sham energies: “ksener.dat”. This file should contain everything between the last lines “EIGENVALUES(EV) AND OCCUPATION:” and “CHEMICAL POTENTIAL” in the output.
- File containing the projection of the wavefunctions: “projec.dat”. This file should contain everything between “WAVEFUNCTIONS IN ATOMIC ORBITAL BASIS” and “WAVEFUNCTIONS IN ATOMIC ORBITAL BASIS” in the output
- Compile and run my
FORTRANprogram “dos-ipr.f” in the same directory as the “ksener.dat” and “projec.dat” files - Plot the result, by using, i.e. gnuplot:
gnuplot> p 'dos-ipr.out' u 1:2 w l, '' u 3:4 w i
Finally, you should get something like this graph:
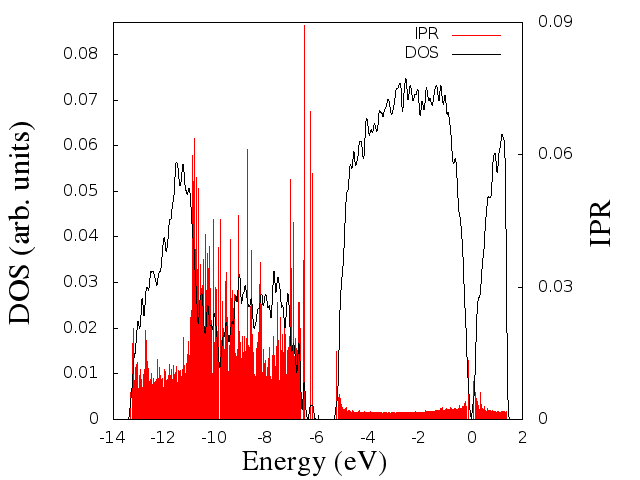
DOS and IPR from CPMD
This graph example was done for a Ge2Sb2Te5 sample.
This is a simple explanation of how to do it, but whenever I find a little time, I will rewrite it again in python, so that, one does not have to parse the ksener.dat and projec.dat files by hand, and maybe, even automatize the graph, just as I did with the sum_states.py for quantum espresso.