In this post, I introduce my new cube2xyz script for converting cube data into “x,y,z,value” format and optionally creating nice 2D or 3D plots displaying the value of the cube property along a segment or a surface.
.cube files are originally from the Gaussian molecular modeling code, but nowadays can be produced and read by most of the computational chemistry programs. They consist of a lot of blocks of data describing the values of a measured property (charge, spin polarization, electronic density, …) on each point of the space inside the simulation cell.
The cube files are formatted as follows:
- 1st and 2nd lines: comment/free text
- 3rd line: Total number of atoms, and xyz coordinates of the origin of the volume data
- 4th to 6th line: number of voxels (partition points) for each axis followed axis vectors. If the number of voxels is possitive the units are in Bohr if it is negative in Angstrom.
- 7th to No. of atoms: atom number, no. of electrons and xyz coordinates for each atom
- from there to the EOF: blocks of n voxels in xyz containing the value of the property measured in the cube file
Let us think that we want to simulate an isolated molecule in vacuum, but we are not sure of whether our simulation box is large enough to prevent interactions with periodic replica. In this case, we can use the cube2xyz script to plot the data and check that a given magnitude (for example charge, electronic density…) is converged around the molecule.
In the following picture, there is a representation of the charge density of a water molecule on a 10 a.u. (5.29 Å)cubic cell. The command used was “cube2xyz-v0.1.py -f out.char.cube -o xyzspol.dat -x 1 -pl -A” and the result looks like this:
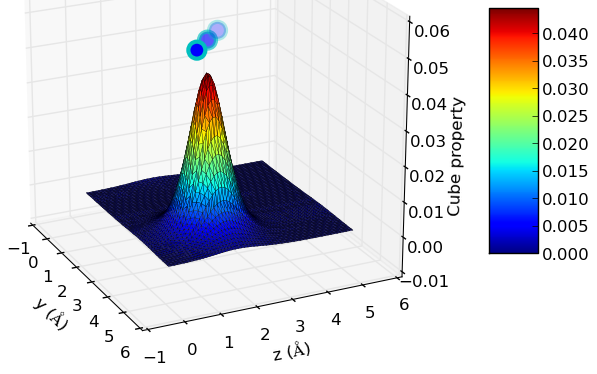
Charge density of a water molecule on a 10 a.u. cubic cell.
The little spheres above the surface represent the projection of the coordinates of the atoms on the represented plane. For example, if we want to display the values of the cube property along the x=x1 plane, the atoms will be represented as “max(property value)+C, y, z”, where “C” is a scaling factor in order to put the atoms slightly higher than the highest surface peak.
If we want to represent the cube property only on one direction, we just have to set the values for two axes, and the value will be represented along the intersection segment of the two perpendicular planes to those axes at those points.
This can be useful, for example, when we want to calculate how much is the minimum amount of vacuum we should add on a top of a surface, so that it does not interact with itself.
This is an example of usage for this case: “cube2xyz-v0.1.py -f out.char.cube -o xyzspol.dat -x 1 -y 3.7 -pl -A ”
And the result will look like this:
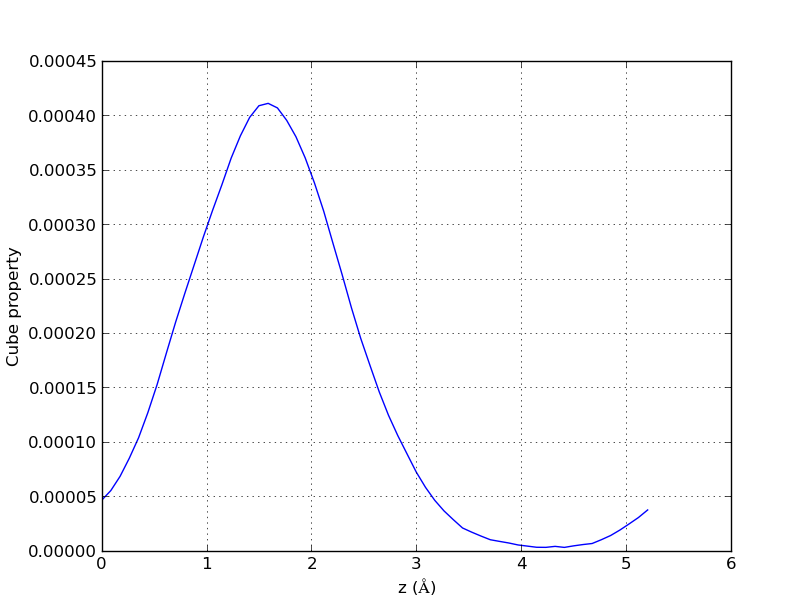
2D representation of charge density of a water molecule along a segment.
The usage information can be as usual obtained with the -h option on the command line, and in this case, it looks like:
usage: cube2xyz-v0.1.py [-h] -f FILE_NAME [-o OUT_FILE] [-pr PRINT_RANGE]

[-x X_COORD] [-y Y_COORD] [-z Z_COORD] [-pl] [-A]

[-no]project values on planes (slizes) or segments. Optionally, it can directly
produce the plot for a faster visualization.
optional arguments:
-h, –help show this help message and exit
-f FILE_NAME, –file_name FILE_NAME
Name of cube file
-o OUT_FILE, –out_file OUT_FILE
Name of the file to which print the output (otherwise
printed to Standard Output).
-pr PRINT_RANGE, –print_range PRINT_RANGE
Print the range of x,y or z values and exit.
-x X_COORD, –x_coord X_COORD
Show only the values of x at this point.
-y Y_COORD, –y_coord Y_COORD
Show only the values of y at this point.
-z Z_COORD, –z_coord Z_COORD
Show only the values of z at this point.
-pl, –plot Plot graph using Mathplotlib.
-A, –angstrom Convert all distances to Angstrom.
-no, –no_output Do not produce any outupt.
Usage: cube2xyz -f out.spol.cube -o xyzspol.dat -x 3.1 -pl -A
The script can be found on my github repository: cube2xyz-v0.1.
The cube files can be easily produced in Quantum Espresso, by running a single point calculation of the wavefunction (SCF) and using the pp.x tool. In CPMD, you can use the cpmd2cube tool.
A final note: the current version (0.1) of cube2xyz only supports orthogonal lattice vectors, so it only works for cubic, tetragonal and orthorhombic unit cells.
This is good script, tanks very much…. 🙂
Hi Julen,
Thanks for this very useful script. I am wondering if it is possible to project the cube file on to a plan that is not perpendicular to x, y, or z. Say, if I can project the cube file on to the [110] plane of a cubic file. Or even for a cube file that is generated from a non-cubic cell.
Thanks,
Lesheng
Hi Lesheng,
Unfortunately not. This is a simple script which relies on orthogonal angles, so cubic, tetragonal and orthorhombic. The slicing is done by just choosing the values at a given value of x,y or z.
I made this script for surfaces, and I managed to get everything I needed with horizontal and vertical planes.
You could try to take a look to the script after line 86 and work around the trigonometry.
Hi Julen,
Thanks, I already wrote one than can project on [110] plane. But to do that for a non-cubic cell is something challenging.
Best,
Lesheng
Julen,
Many thanks, it is what I needed!
Be safe.